Difference between revisions of "Three-dimensional regional strain analysis in myocardial infarction"
| Line 4: | Line 4: | ||
Sahar Soleimanifard, Khaled Z Abd-Elmoniem, Tetsuo Sasano, Harsh K Agarwal, M Roselle Abraham, Theodore P Abraham, and Jerry L Prince | Sahar Soleimanifard, Khaled Z Abd-Elmoniem, Tetsuo Sasano, Harsh K Agarwal, M Roselle Abraham, Theodore P Abraham, and Jerry L Prince | ||
| + | |||
| + | ''This page is under construction.'' | ||
'''Introduction''' | '''Introduction''' | ||
Revision as of 14:45, 4 June 2014
<meta name="title" content="Three-dimensional regional strain analysis in myocardial infarction" />
Three-dimensional regional strain analysis in myocardial infarction
Sahar Soleimanifard, Khaled Z Abd-Elmoniem, Tetsuo Sasano, Harsh K Agarwal, M Roselle Abraham, Theodore P Abraham, and Jerry L Prince
This page is under construction.
Introduction
Before advances in cardiovascular magnetic resonance (CMR) methods allowed for three-dimensional (3D) interrogation of myocardial strain, one-dimensional (1D) and two dimensional (2D) strain analysis was the standard. The aim of this study was to investigate the incremental value of CMR-based 3D strain and to test the hypothesis that 3D strain is superior to 1D or 2D strain analysis in the assessment of viability using a porcine model of infarction.
Method ___________________________________________________________________________________________________________________________________________________________________________
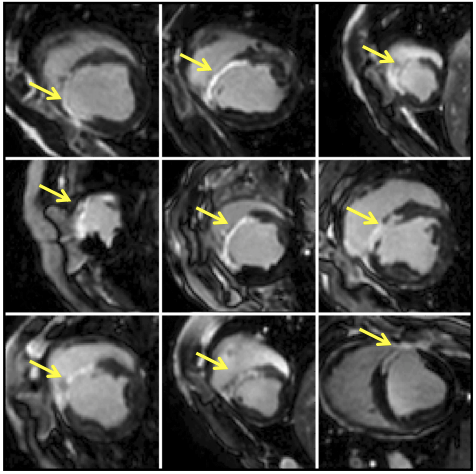
Figure 1 ___________________________________________________________________________________________________________________________________________________________________________
Example LGE images in nine animals. Myocardial infarction is mainly located in the anterior wall and anterior septum with transmurality greater than 90% of the wall thickness (yellow arrows). Isolated infarct zones, and slices with sub-endocardial infarct and no presence of transmural infarct were not observed in the entire dataset. ___________________________________________________________________________________________________________________________________________________________________________
All animal studies complied with the Institutional Animal Care and Use Committee and conformed to Guide for the Care and Use of Laboratory Animals.
MI was induced in twenty young farm pigs with weights from twenty five to thirty five kilograms. An Angioplasty balloon was inserted into the left anterior descending coronary artery (LAD) and inflated to a location just distal to the second diagonal branch of the LAD. After One hundred and fifty minutes, the occlusion of the artery was terminated. All surviving animals progressed to heart failure and were monitored daily.
Images then were acquired at 11±6 days (baseline) pre-MI, and at 11±4 days (early) and 34±8 days (late) post-MI. In all animals, Cine, LGE (late gadolinium enhancement), and CMR tagging images (zHARP images) were all acquired. Harmonic phase analysis was performed to measure circumferential, longitudinal, and radial strains in myocardial segments, which were defined based on the transmurality of delayed enhancement. Univariate, bivariate, and multivariate logistic regression models of strain parameters were created and analyzed to compare the overall diagnostic accuracy of 3D strain analysis with 1D and 2D analyses in identifying the infarct and its adjacent regions from healthy myocardium.
___________________________________________________________________________________________________________________________________________________________________________
Figure 2 ___________________________________________________________________________________________________________________________________________________________________________ This figure illustrates epicardial and endocardial borders and the transmural infarct border points on an example LGE and five zHarp images as selected cardiac phases. (A) Epicardial and endocardial borders (blue contours) and borders of transmural MI (red points) are delineated on the LGE image. Myocardial tissue enclosed between MI points is called the infarct segment. The rest of the myocardium is divided into equal segments. Infarct segment 1; Adjacent: segment 2, and 6; Remote: segment 3, 4, and 5. (B) Landmarks delineated on the LGE image are mapped and located on all zHarp cardiac phases by Harp tracking and myocardium is divided into segments accordingly. Five cardiac phases are selected for demonstration. ___________________________________________________________________________________________________________________________________________________________________________
Cine and LGE images were analyzed using QMass and MR software. LV epicardial and endocardial borders, excluding papillary muscles, were traced in end-diastolic and end-systolic cine short-axis images to measure global function. The semi-automated full-width-at-half-maximum method was employed to identify the infarct zone on LGE images. The cine and LGE images were analyzed prior to the strain analysis in a blinded manner. For each zHARP slice, the closest LGE slice was identified and mapped to its corresponding mid-diastolic zHARP image using an affine registration.
Results
___________________________________________________________________________________________________________________________________________________________________________
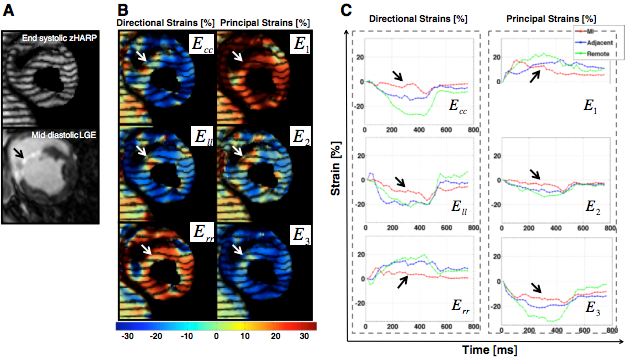
Figure 3 ___________________________________________________________________________________________________________________________________________________________________________ Figure A shows an example of an end-systolic zHARP image and its corresponding mid-diastolic LGE image in one animal at early post-MI. Directional and principal strains overlaid on the zHARP image and their temporal profile are shown in Figure B and C, respectively. Reduced magnitudes were observed in all strain indices in infarct segments versus adjacent and remote segments (Figure C, black arrows). ___________________________________________________________________________________________________________________________________________________________________________ Out of the twenty animals, five died due to incessant ventricular fibrillation. Surviving animals all completed the imaging protocol. 3D strain differed significantly in infarct, adjacent, and remote segments (p < 0.05) at early and late post-MI. In univariate, bivariate, and multivariate analyses, circumferential, longitudinal, and radial strains were significant factors (p < 0.001) in differentiation of infarct and adjacent segments from baseline values. In identification of adjacent segments, receiver operating characteristic analysis using the 3D strain multivariate model demonstrated a significant improvement (p < 0.01) in overall diagnostic accuracy. Overall, 3D strain analysis showed a 96% diagnostic accuracy with 2D strain analysis showing an 81% diagnostic accuracy with 1D strain analysis left at 71% diagnostic accuracy.
Conclusion
3D strain analysis showed to be 15% more accurate than 2D strain analysis and 25% more accurate than 1D strain analysis when it came to diagnostic accuracy. Multivariate 3D strain analysis using CMR accurately differentiates infarct from normal myocardium and correlates with delayed enhancement. Furthermore, cumulative 3D strain is superior to 1D and 2D strain analyses for identification of infarct neighboring regions. Using this technique on human subjects will help determine the clinical value of 3D regional strain quantification.
Acknowledgements
We thank Evert-Jan Vonken, MD, PhD, and Michael Schär, PhD for kindly providing the technical expertise with CMR acquisitions, and Amr Youssef, MD for help with animal studies. This work was supported in part by NIH/NHLBI research grant R01HL47405.
References
- Soleimanifard et al.: Three-dimensional regional strain analysis in porcine myocardial infarction: a 3T magnetic resonance tagging study. Journal of Cardiovascular Magnetic Resonance 2012 14:85. doi:10.1186/1532-429X-14-85
- Soleimanifard et al.: Identification of Myocardial Infarction using Three-dimensional Strain Tensor Fractional Anisotropy. Proceedings of the IEEE International Symposium on Biomedical Imaging: From Nano to Macro, 2010; 468-471, Rotterdam, the Netherlands.
- Soleimanifard et al.: Three-dimensional Principal Strain Patterns in Acute Myocardial Infarction. International Society for Magnetic Resonance in Medicine Annual Meeting, 2011, Montreal, Canada.
- Soleimanifard et al.: Visualization of infarction using fractional anisotropy. Journal of Cardiovascular Magnetic Resonance, 2010; 12(Supp 1): P153, Phoenix, AZ.
- Solemanifard et al.: Visualization of infarction using fractional anisotropy. Journal of Cardiovascular Magnetic Resonance, 2010; 12(Supp 1): P153, Phoenix, AZ.


